
Inherent
characteristics of control valve
1. EXCLUSIVE SUMMARY
The objective of this experiment is to
study the inherent
characteristics of control valve. To achieve this objective, the apparatus
shown in the figure 1 was used. An equal percentage valve overcompensates for
line loss and produces an effective characteristic that is not linear, but is
bowed in the opposite direction to that of the effective characteristic of the
linear valve. One can show that as the line loss increases, the linear valve will
depart more from the ideal linear relation and the equal percentage valve will
move more closely toward the linear relation. Pressure drop of water in equal%,
quick opening and linear valve are in the range of 101.2 -147.6, 33.6-147.6 and
83.6- 147.6 mm respectively.
2. INTRODUCTION
The control valve is
essentially a variable resistance to the flow of a fluid, in which the
resistance and therefore the flow, can be changed by a signal from a process
controller.
The function of a control
valve is to vary the flow of fluid through the valve by means of a change of
pressure to the valve top. The relation between the flow through the valve and
the valve stem position (or lift) is called the valve characteristic.
In general, the flow
through a control valve for a specific fluid at a given temperature can be
expressed as:

where,
q = volumetric flow rate
L = valve stem position (or
lift)
po = upstream pressure
pt = downstream pressure
The inherent valve
characteristic is determined for fixed values of pa and p 1.

where,
qmax is the maximum flow
when the valve stem is at its maximum lift L (valve is full-open)
x is the fraction of maximum
lift
m is the fraction of maximum
flow.
m = q/q(max) =f(L/L(max))
The types of valve
characteristics can be defined in terms of the sensitivity of the valve, which
is simply the fractional change in flow to the fractional change in stem
position for fixed upstream and downstream pressures.
sensitivity = dm/dx
In terms of valve
characteristics, valves can be divided into three types:
1) Decreasing sensitivity,
2) linear Sensitivity,
3) Increasing sensitivity.
For the decreasing
sensitivity type, the sensitivity (or slope) decreases with m . For the linear
type, the sensitivity is constant and the characteristic curve is a straight
line. For the increasing sensitivity type, the sensitivity increases with flow.
Valve characteristic curves
can be obtained experimentally for any valve by measuring the flow through the
valve as a function of lift (or valve-top pressure) under conditions of
constant upstream and downstream pressures. The linear valve is one for which
the sensitivity is constant and the relation between flow and lift is linear.
The equal percentage valve is of the increasing sensitivity type.
3. OBJECTIVE
To study the inherent characteristics of control valve.
4. Experimental Setup
 |
| Control valve set-up |
The setup is designed
to understand the control valve operation and its flow characteristics. It
consists of pneumatic control valves of linear, equal% (& quick opening)
type, stainless steel water tank with pump for continuous water circulation and
rotameter for flow measurement. An arrangement is made to measure pressure at
the valve inlet in terms of mm of water. An air regulator and pressure gauge is
provided for the control valve actuation. In case of additional optional
requirement a valve positioner is fitted on linear valve.
1.
Open the manual
plug valve of equal percentage (air-to-close) control valve.
2.
Open the valve up
to 14 mm travel (full open).
3.
Adjust the
regulatory valve at the inlet of the control valve to maintain the flow at 400
LPH. Note down the pressure drop
4.
Slowly increase
the air pressure by air regulator and close the control valve to travel the
stem by 2 mm.
5.
The pressure drop
across the valve will increase. Maintain the pressure drop by adjusting the
regulatory valve. Observe the flow rates
6.
Take the
observations at each 2 mm stem travel till the valve is fully closed by
repeating the above step
7.
Plot the graph of
flow % of maximum versus valve lift % of full lift
8.
Repeat the experiment for linear
valve (air to open).
6. Results and Discussions'
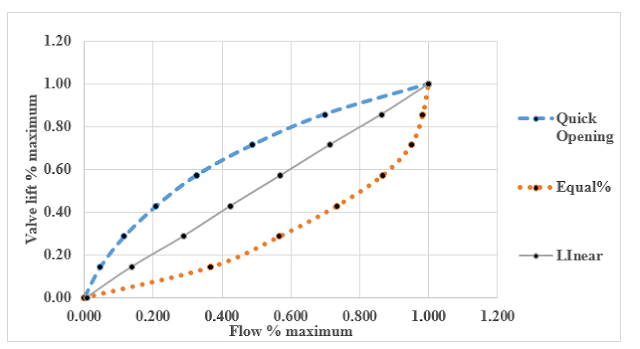 |
Inherent characteristics curves for equal%, linear
and quick opening control valve
|
The above figure show the inherent
characteristics of equal%, linear and quick opening valve. Valve lift in
percentage is represent on y-axis and flow in percentage is represent on the
x-axis.
An equal percentage valve overcompensates
for line loss and produces an effective characteristic that is not linear, but
is bowed in the opposite direction to that of the effective characteristic of
the linear valve. One can show that as the line loss increases, the linear
valve will depart more from the ideal linear relation and the equal percentage
valve will move more closely toward the linear relation. Pressure drop of water
in equal%, quick opening and linear valve are in the range of 101.2 -147.6,
33.6-147.6 and 83.6- 147.6 mm respectively.
7. CONCLUSIONS
It is often stated
in the control literature that the benefit derived from an equal percentage
valve arises from its inherent nonlinear characteristic that compensates for
the line loss to give an effective valve characteristic that is nearly linear. An
equal percentage valve overcompensates for line loss and produces an effective
characteristic that is not linear, but is bowed in the opposite direction to
that of the effective characteristic of the linear valve. One can show that as
the line loss increases, the linear valve will depart more from the ideal
linear relation and the equal percentage valve will move more closely toward
the linear relation.
Pressure
drop of water in equal%, quick opening and linear valve are in the range of
101.2 -147.6, 33.6-147.6 and 83.6- 147.6 mm respectively. Gradually close the
control valve in steps of 4mm of stem travel. The pressure drop across the
valve increases.
8.
References
1. Coughanowr
D., LeBlanc S., ‘Process Systems Analysis and Control’, Mc-Graw Hill Science Engineering
Math, 2nd Edition, 2008, P-300-303.


